Better business planning and forecasting using Prophet

Introduction:
When involved in yearly business planning, the process can be time-consuming and complex, especially without the right tools and methodology. This often leads to an endless collection of spreadsheets, formulas, and heuristic assumptions, which makes the output difficult to understand and amend.
Forecasting next year's sales for an e-commerce business or new users for a subscription business is a common exercise that, without the right approach, can lead to a significant gap between forecasted and actual numbers.
One effective approach is to utilize time series models like Prophet, developed by Facebook's Core Data Science team, to forecast sales or subscription numbers more accurately. Prophet is great at handling complex scenarios, including multiple seasonality patterns, holiday effects, and trend changes. It automates much of the forecasting process, making it accessible to non-experts and experienced data scientists alike, while allowing for customization to address specific challenges.
Here's a quick guide to using Prophet with a dummy e-commerce dataset. The collaborative notebook is available here.
Step 1 - Create the dataset
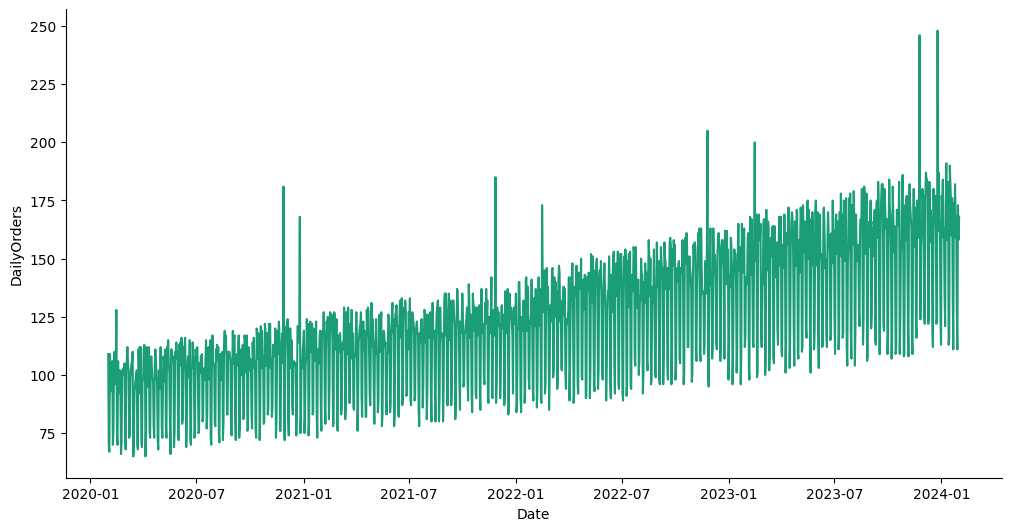
The dataset contains:
- Daily orders for the last four years, considering leap years.
- Seasonality increases around Black Friday, Christmas, and Valentine's Day.
- A monthly growth rate corresponding to a CAGR of approximately 15%.
- Non-linear order patterns with random fluctuations.
- Weekly seasonality with lower orders during weekends.

import pandas as pd
import numpy as np
from datetime import datetime
from pandas.tseries.offsets import DateOffset

# Function to calculate the Compound Annual Growth Rate (CAGR)
def calculate_cagr(end_value, start_value, periods):
    return (end_value/start_value)**(1/periods) - 1

# Function to introduce non-linearity and weekly seasonality in orders
def calculate_adjusted_orders(date, base_orders, monthly_growth_rate, start_date):
    # Non-linear factor: Introduce random fluctuations
    random_factor = np.random.uniform(0.9, 1.1)

    # Calculate the number of months since the start date
    months_since_start = ((date.year - start_date.year) * 12 + date.month - start_date.month)

    # Apply the monthly growth rate with random fluctuations
    orders = base_orders * (1 + monthly_growth_rate) ** months_since_start * random_factor

    # Seasonality increases
    # Black Friday, Christmas, and Valentine's Day
    if date.month == 11 and date.weekday() == 4 and 22 <= date.day <= 28:
        orders *= 1.5
    elif date.month == 12 and date.day == 25:
        orders *= 1.4
    elif date.month == 2 and date.day == 14:
        orders *= 1.3

    # Weekly seasonality: Decrease orders on weekends
    if date.weekday() in [5, 6]:  # Saturdays and Sundays
        orders *= 0.7  # 30% less orders on weekends

    return np.round(orders)

# Set the start and end dates for the 4-year period
end_date = datetime.today()
start_date = end_date - DateOffset(years=4)

# Create a date range
dates = pd.date_range(start=start_date, end=end_date, freq='D')

# Initialize the DataFrame
df = pd.DataFrame({'Date': dates})

# Setting initial parameters
base_orders = 100  # Arbitrary base number of orders
annual_growth_rate = 0.15  # 15% annual growth rate
monthly_growth_rate = calculate_cagr(1 + annual_growth_rate, 1, 12)  # Convert annual rate to monthly

# Apply the function with adjustments for non-linearity and weekly seasonality
df['DailyOrders'] = df['Date'].apply(lambda date: calculate_adjusted_orders(date, base_orders, monthly_growth_rate, start_date))

# Display the first few rows of the DataFrame
df.head()
Step 2 - We create the forecast
We create two new columns, 'ds' and 'y', as this is the format expected by Prophet. 'ds' should be in pandas datetime format (use df.info() to verify this).
To forecast a year of sales, we define 'periods' as 365 days.
from prophet import Prophet

m = Prophet()
m.fit(df)

future = m.make_future_dataframe(periods=365)
future.tail()

forecast = m.predict(future)
forecast[['ds', 'yhat', 'yhat_lower', 'yhat_upper']].tail()
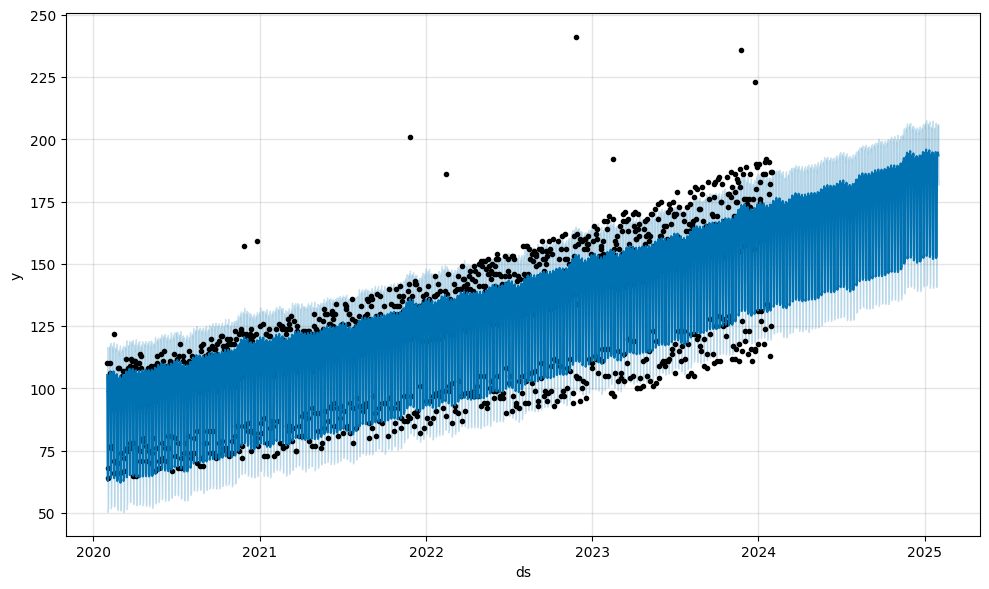
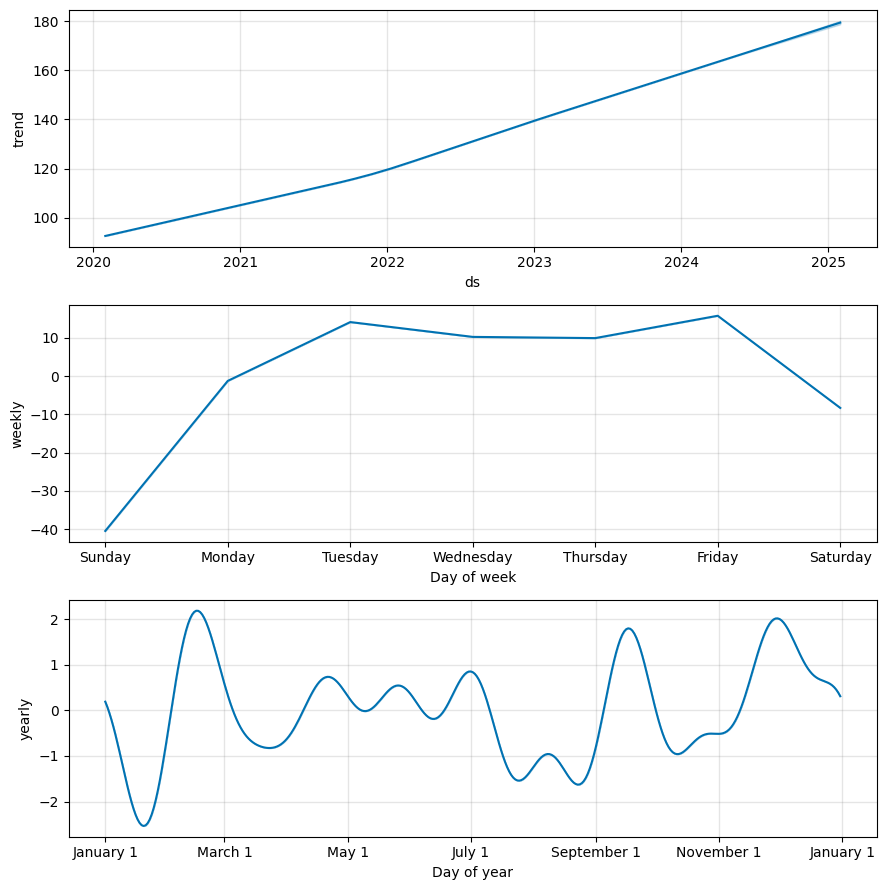
You can then plot the results to visualize the forecast:
fig1 = m.plot(forecast)

fig2 = m.plot_components(forecast)
Conclusion
This approach to forecasting is simple and straightforward but should be augmented with business knowledge and other relevant information. It's important to remember that while tools like Prophet can significantly simplify forecasting, they are not a substitute for a nuanced understanding of your business environment.


Comments ()